Understanding GIS
As the old saying goes, "Seeing is believing." That is what Geographic Information Systems (GIS) do in the purest sense. GIS is a combination of computers, software, databases, and professionals that answer questions and map information in ways never done before. It is intelligent mapping and examination of data, be it information related to unemployment rates by county, industrial parks located in a city, businesses with an address, etc. If the data has a location assigned to it, then GIS can help analyze it.
An analogy may be appropriate to better understand GIS. First, imagine taking a Microsoft Excel spreadsheet of the U.S. population by state and making a chart of it.

This will show the user which states have the highest populations down to the lowest populations. GIS is needed, however, to view where these states are and how they relate to other states and other features (coastline, cities, interstates, climate, etc.). The spreadsheet could be brought into the GIS and the states categorized by population. Patterns in the population can then be seen.
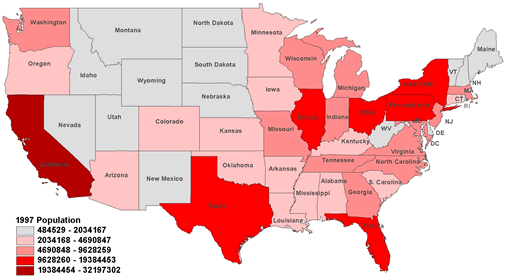
The above example describes a basic GIS function. Initial patterns revealed in a quick map like the one above usually lead to additional questions such as "what relationships helped create these patterns?" GIS can help answer this by:
- Analyzing the spatial relationship between different information.
- Does the proximity to historical ports or rivers play a role?
- Overlaying different layers of information.
- Do climate zone maps reveal any new insight when overlaid over states?
- Categorizing and symbolizing data differently to better understand the information.
- Would the population density per sq. mile reveal different patterns?
The great thing about GIS is that the final product of analysis is not only numbers but also maps. Another wonderful feature is that it can respond very quickly to changes in analysis, data or the needs of the client. The wheel does not have to be reinvented with GIS, just given another spin. The end result is better decision-making.
Economic Development is on Target with GIS.
Now that GIS is better understood, how does the Missouri Department of Economic Development (DED) use it?
GIS Now
GIS is currently used by DED to illustrate information about Missouri. This means much more than just making maps. Many factors have to be considered in generating products, like who is the intended audience, what features need to be highlighted, how should data be classified and represented for the particular situation, etc. The following maps are examples from the GIS team.
 Dentist in Missouri Map |
 Target Industries Map |
 City Labor Force Map |
In addition to illustrations, GIS is used to analyze data and develop new information. For example, the location of large business airports in Missouri is an important criterion for many relocating companies. GIS was used to map areas in the state within 25 to 50 miles of large business airports and to determine the land area and population within these areas. In another example, the system was used to determine the number of highway miles within each Missouri county for use in a detailed economic modeling program.
As mentioned earlier, GIS is not just computers and software. It relies heavily on good database information and on professionals who know how to analyze the information. A diverse team of professionals with backgrounds in economic development, economics, geography, land planning, environmental analysis, and site selection are crucial to effective GIS in Economic Development.
Aiming for the Future
Soon the GIS team will offer interactive maps of Missouri that can be accessed over the web. These interactive maps would allow users to choose from a variety of data, select features of a map, zoom in for closer scrutiny, and see specific data on selected items. Finally, the user would be able to print a map of desired features. This is cutting edge GIS technology and DED is proud to make this information available.
In addition to the Internet, the team is working toward the development of a comprehensive site selection tool for businesses looking to locate or expand in Missouri. Many companies need help in deciding where to launch an operation. Using GIS, a multitude of data can be analyzed at various scales. Counties can be viewed in terms of population, unemployment, education, etc. Cities can be analyzed for infrastructure, schools, labor force, available properties, etc. Individual properties can be reviewed for their suitability for a particular company in terms of environmental constraints, access, and property configuration. GIS then can help businesses find the right place to set up shop in Missouri.
"Seeing is believing" with GIS. In today's world, businesses and individuals need to make good decisions, fast. When asked to "Show Me," the department's GIS Team can

