
St. Louis County had the highest per capita income in Missouri in 2001, according to recently released data from the U.S. Bureau of Economic Analysis. The county's per capita income of $41,573 was more than $13,000 higher than the state average in 2001 of $28,221. Fourteen counties in Missouri and St. Louis City had per capita incomes of $25,000 or higher. DeKalb County, $14,742, had the lowest per capita income. Four counties in Missouri had per capita incomes below $16,000.
Source: U.S. Bureau of Economic Analysis

| Missouri Per Capita Income 2001 | |||
|---|---|---|---|
| Ten Highest Counties | Ten Lowest Counties | ||
| County | PCI 2001 | County | PCI 2001 |
| St. Louis | $41,573 | Bollinger | $16,514 |
| Platte | $35,053 | Ripley | $16,445 |
| Jackson | $31,031 | Wright | $16,349 |
| St. Charles | $30,546 | Wayne | $16,067 |
| Clay | $30,535 | Hickory | $16,042 |
| Cole | $30,509 | Douglas | $16,027 |
| Greene | $28,111 | Oregon | $15,980 |
| Boone | $28,020 | Shannon | $15,543 |
| St. Louis City | $27,984 | Texas | $15,260 |
| Cape Girardeau | $26,543 | DeKalb | $14,742 |
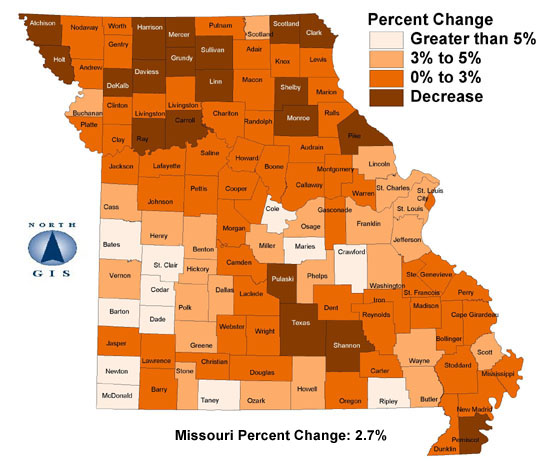
Missouri's per capita income rose by 2.7 percent from $27,493 in 2000 to $28,221 in 2001. The greatest increase was in McDonald County at 8.9 percent, with an increase of $1,420 in per capita income. Twelve Missouri counties had an increase of 5 percent or higher. Despite the overall state increase, per capita income actually decreased in 20 Missouri counties. Scotland County had the largest decrease in per capita income between 2000 and 2001 with a drop of 8.9 percent.
| Missouri Per Capita Income Percent Change 2000 - 2001 | |||||||
|---|---|---|---|---|---|---|---|
| Ten Highest Counties | Ten Lowest Counties | ||||||
| County | 2000 | 2001 | % Chg | County | 2000 | 2001 | % Chg |
| McDonald | $16,027 | $17,447 | 8.86% | DeKalb | $15,048 | $14,742 | -2.03% |
| Maries | $18,124 | $19,391 | 6.99% | Pulaski | $24,824 | $24,297 | -2.12% |
| Bates | $19,356 | $20,685 | 6.87% | Holt | $21,694 | $21,140 | -2.55% |
| Dade | $20,219 | $21,598 | 6.82% | Atchison | $24,225 | $23,526 | -2.89% |
| Taney | $20,942 | $22,342 | 6.69% | Harrison | $20,192 | $19,515 | -3.35% |
| Cedar | $16,988 | $17,935 | 5.57% | Texas | $15,823 | $15,260 | -3.56% |
| Crawford | $19,752 | $20,806 | 5.34% | Daviess | $21,040 | $20,048 | -4.71% |
| Ripley | $15,633 | $16,445 | 5.19% | Shelby | $22,694 | $21,305 | -6.12% |
| St. Clair | $16,907 | $17,777 | 5.15% | Clark | $18,761 | $17,461 | -6.93% |
| Cole | $29,020 | $30,509 | 5.13% | Scotland | $20,101 | $18,306 | -8.93% |
Counties with decreased per capita incomes tended to be in northern and south central Missouri. Between 1999 and 2000, many of these same counties reported increases of greater than 10 percent over the year. Revisions to previous data estimates seem largely responsible for the tremendous fluctuation in per capita income in these counties.
| Missouri Per Capita Income Change 2000-2001 | |||||||
|---|---|---|---|---|---|---|---|
| County | 2000 | 2001 | % chg 00-01 | County | 2000 | 2001 | % chg 00-01 |
| Missouri total | $27,493 | $28,221 | 2.6% | Linn | $21,328 | $21,103 | -1.1% |
| Adair | $20,427 | $20,912 | 2.4% | Livingston | $25,130 | $25,463 | 1.3% |
| Andrew | $23,193 | $23,352 | 0.7% | McDonald | $16,027 | $17,447 | 8.9% |
| Atchison | $24,225 | $23,526 | -2.9% | Macon | $20,274 | $20,591 | 1.6% |
| Audrain | $22,729 | $22,797 | 0.3% | Madison | $18,115 | $18,550 | 2.4% |
| Barry | $19,986 | $20,405 | 2.1% | Maries | $18,124 | $19,391 | 7.0% |
| Barton | $20,417 | $21,439 | 5.0% | Marion | $22,717 | $23,281 | 2.5% |
| Bates | $19,356 | $20,685 | 6.9% | Mercer | $19,322 | $19,103 | -1.1% |
| Benton | $17,746 | $18,625 | 5.0% | Miller | $17,714 | $18,261 | 3.1% |
| Bollinger | $16,203 | $16,514 | 1.9% | Mississippi | $19,991 | $20,016 | 0.1% |
| Boone | $27,396 | $28,020 | 2.3% | Moniteau | $19,439 | $20,002 | 2.9% |
| Buchanan | $24,281 | $25,081 | 3.3% | Monroe | $20,721 | $20,361 | -1.7% |
| Butler | $22,219 | $23,317 | 4.9% | Montgomery | $21,639 | $21,791 | 0.7% |
| Caldwell | $18,888 | $19,446 | 3.0% | Morgan | $18,329 | $18,809 | 2.6% |
| Callaway | $20,945 | $21,158 | 1.0% | New Madrid | $19,408 | $19,622 | 1.1% |
| Camden | $23,044 | $23,536 | 2.1% | Newton | $20,462 | $21,510 | 5.1% |
| Cape Girardeau | $25,850 | $26,543 | 2.7% | Nodaway | $20,130 | $20,359 | 1.1% |
| Carroll | $20,754 | $20,739 | -0.1% | Oregon | $15,541 | $15,980 | 2.8% |
| Carter | $17,720 | $18,015 | 1.7% | Osage | $24,012 | $25,203 | 5.0% |
| Cass | $25,516 | $26,493 | 3.8% | Ozark | $16,007 | $16,630 | 3.9% |
| Cedar | $16,988 | $17,935 | 5.6% | Pemiscot | $18,976 | $18,953 | -0.1% |
| Chariton | $21,444 | $21,650 | 1.0% | Perry | $22,236 | $22,573 | 1.5% |
| Christian | $20,351 | $20,529 | 0.9% | Pettis | $22,902 | $23,325 | 1.8% |
| Clark | $18,761 | $17,461 | -6.9% | Phelps | $21,843 | $22,772 | 4.3% |
| Clay | $30,218 | $30,535 | 1.0% | Pike | $19,110 | $19,093 | -0.1% |
| Clinton | $24,909 | $24,981 | 0.3% | Platte | $34,062 | $35,053 | 2.9% |
| Cole | $29,020 | $30,509 | 5.1% | Polk | $17,450 | $18,292 | 4.8% |
| Cooper | $20,799 | $20,922 | 0.6% | Pulaski | $24,824 | $24,297 | -2.1% |
| Crawford | $19,752 | $20,806 | 5.3% | Putnam | $17,471 | $17,659 | 1.1% |
| Dade | $20,219 | $21,598 | 6.8% | Ralls | $21,000 | $21,070 | 0.3% |
| Dallas | $18,233 | $18,864 | 3.5% | Randolph | $20,105 | $20,215 | 0.5% |
| Daviess | $21,040 | $20,048 | -4.7% | Ray | $21,255 | $21,228 | -0.1% |
| DeKalb | $15,048 | $14,742 | -2.0% | Reynolds | $16,828 | $17,122 | 1.7% |
| Dent | $19,057 | $19,548 | 2.6% | Ripley | $15,633 | $16,445 | 5.2% |
| Douglas | $15,604 | $16,027 | 2.7% | St. Charles | $29,569 | $30,546 | 3.3% |
| Dunklin | $19,667 | $19,978 | 1.6% | St. Clair | $16,907 | $17,777 | 5.1% |
| Franklin | $25,082 | $25,899 | 3.3% | Ste. Genevieve | $21,818 | $22,100 | 1.3% |
| Gasconade | $22,048 | $22,420 | 1.7% | St. Francois | $19,015 | $19,507 | 2.6% |
| Gentry | $20,493 | $20,776 | 1.4% | St. Louis | $40,354 | $41,573 | 3.0% |
| Greene | $27,016 | $28,111 | 4.1% | Saline | $22,421 | $22,682 | 1.2% |
| Grundy | $21,601 | $21,433 | -0.8% | Schuyler | $16,908 | $17,419 | 3.0% |
| Harrison | $20,192 | $19,515 | -3.4% | Scotland | $20,101 | $18,306 | -8.9% |
| Henry | $20,618 | $21,457 | 4.1% | Scott | $21,697 | $22,471 | 3.6% |
| Hickory | $15,399 | $16,042 | 4.2% | Shannon | $15,626 | $15,543 | -0.5% |
| Holt | $21,694 | $21,140 | -2.6% | Shelby | $22,694 | $21,305 | -6.1% |
| Howard | $19,846 | $19,967 | 0.6% | Stoddard | $20,178 | $20,205 | 0.1% |
| Howell | $18,629 | $19,483 | 4.6% | Stone | $21,999 | $22,880 | 4.0% |
| Iron | $17,061 | $17,539 | 2.8% | Sullivan | $22,023 | $21,820 | -0.9% |
| Jackson | $30,405 | $31,031 | 2.1% | Taney | $20,942 | $22,342 | 6.7% |
| Jasper | $23,394 | $23,772 | 1.6% | Texas | $15,823 | $15,260 | -3.6% |
| Jefferson | $22,992 | $23,775 | 3.4% | Vernon | $19,389 | $20,159 | 4.0% |
| Johnson | $20,581 | $21,113 | 2.6% | Warren | $23,301 | $23,906 | 2.6% |
| Knox | $20,421 | $20,527 | 0.5% | Washington | $16,096 | $16,631 | 3.3% |
| Laclede | $19,784 | $20,190 | 2.1% | Wayne | $15,509 | $16,067 | 3.6% |
| Lafayette | $23,391 | $23,851 | 2.0% | Webster | $16,948 | $17,294 | 2.0% |
| Lawrence | $17,712 | $17,994 | 1.6% | Worth | $16,643 | $16,648 | 0.0% |
| Lewis | $17,960 | $18,211 | 1.4% | Wright | $16,342 | $16,349 | 0.0% |
| Lincoln | $22,111 | $22,876 | 3.5% | St. Louis City | $27,174 | $27,984 | 3.0% |
