
The Missouri Department of Revenue released preliminary taxable sales estimates for the 3rd quarter of 2012. Over this period, approximately $19.1 billion in taxable sales occurred in the state, a slight decrease of 0.61% in actual dollars from the same quarter of 2011. The decrease in sales in the 3rd quarter sales compared to the same quarter last year would mark the first quarter in the previous ten that there was a decrease in taxable sales.
| Quarterly Taxable Sales in Missouri | ||||
| Taxable Sales ($B) | % Change from Year Ago | Inflation & Seasonally Adjusted ($B-00) | % Change from Year Ago (Adjusted) | |
| 3Q04 | 17.7 | 4.14% | 15.8 | 1.40% |
| 4Q04 | 18.4 | 4.16% | 15.8 | 0.81% |
| 1Q05 | 16.6 | 4.65% | 16.2 | 1.56% |
| 2Q05 | 18.3 | 5.32% | 16.1 | 2.30% |
| 3Q05 | 18.4 | 3.78% | 15.8 | -0.05% |
| 4Q05 | 19.5 | 6.06% | 16.1 | 2.24% |
| 1Q06 | 17.7 | 6.13% | 16.6 | 2.39% |
| 2Q06 | 19.3 | 5.45% | 16.3 | 1.38% |
| 3Q06 | 19.2 | 4.16% | 16.0 | 0.81% |
| 4Q06 | 19.8 | 1.37% | 16.0 | -0.56% |
| 1Q07 | 18.2 | 2.89% | 16.6 | 0.43% |
| 2Q07 | 19.6 | 1.59% | 16.1 | -1.03% |
| 3Q07 | 19.6 | 2.09% | 15.9 | -0.28% |
| 4Q07 | 20.1 | 1.85% | 15.7 | -2.04% |
| 1Q08 | 18.2 | -0.05% | 16.0 | -3.96% |
| 2Q08 | 19.5 | -0.50% | 15.4 | -4.70% |
| 3Q08 | 19.5 | -0.55% | 15.0 | -5.56% |
| 4Q08 | 19.4 | -3.38% | 14.9 | -4.92% |
| 1Q09 | 17.2 | -5.01% | 15.2 | -4.97% |
| 2Q09 | 18.3 | -6.26% | 14.6 | -5.15% |
| 3Q09 | 18.1 | -7.10% | 14.2 | -5.56% |
| 4Q09 | 18.9 | -3.05% | 14.3 | -4.42% |
| 1Q10 | 16.9 | -1.87% | 14.5 | -4.39% |
| 2Q10 | 18.4 | 0.44% | 14.5 | -0.92% |
| 3Q10 | 18.5 | 2.15% | 14.4 | 1.08% |
| 4Q10 | 19.0 | 0.72% | 14.2 | -0.82% |
| 1Q11 | 17.1 | 1.11% | 14.4 | -1.02% |
| 2Q11 | 18.8 | 2.33% | 14.3 | -1.00% |
| 3Q11 | 19.2 | 3.78% | 14.4 | 0.01% |
| 4Q11 | 19.9 | 4.58% | 14.3 | 1.27% |
| 1Q12 | 18.1 | 5.70% | 14.8 | 2.89% |
| 2Q12 | 19.4 | 3.01% | 14.5 | 1.07% |
| 3Q12 | 19.1 | -0.61% | 14.0 | -2.29% |

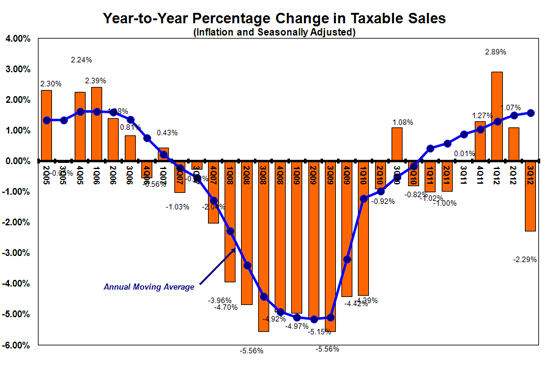

Source: Missouri Department of Revenue and Economy.com
