
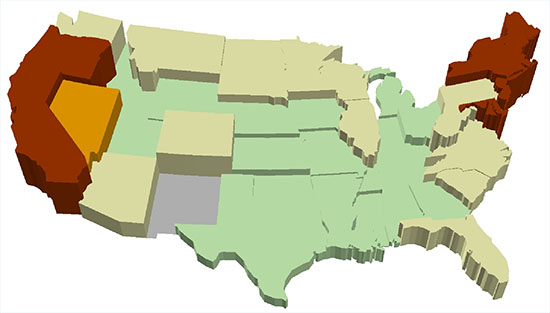
Missouri had the 11th lowest cost of living in the United States for the first quarter of 2015. In general, the most expensive areas to live were New England, Alaska, Hawaii, and the West Coast. The least expensive areas were the Midwest and Southern States.
MERIC derives the cost of living index for each state by averaging the indices of participating cities and metropolitan areas in that state. Missouri’s cost of living for the first quarter of 2015 index was 91.5, down from the first quarter of 2014 index of 93.7.
Cities across the nation participate in ACCRA's survey on a volunteer basis. Price information in the survey is governed by ACCRA collection guidelines which strive for uniformity.

*No new data was available for the state of New Mexico
Composite Cost of Living (Scaled)
First Quarter 2015
| First Quarter 2015 Cost of Living | ||||||||
| State | Rank | Index | Grocery | Housing | Utilities | Transportation | Heath | Misc. |
| Mississippi | 1 | 83.7 | 92.8 | 69.5 | 85.8 | 91.9 | 92.3 | 87.2 |
| Idaho | 2 | 88.2 | 94.9 | 75.4 | 87.4 | 93.2 | 103.4 | 92.8 |
| Oklahoma | 3 | 89.1 | 97.1 | 78.9 | 95.4 | 86.2 | 95.3 | 92.9 |
| Indiana | 4 | 89.6 | 92.2 | 78.6 | 93.3 | 93.1 | 94.7 | 94.9 |
| Kentucky | 5 | 90.0 | 95.8 | 76.4 | 91.8 | 97.2 | 95.3 | 95.3 |
| Tennessee | 6 | 90.4 | 92.4 | 79.0 | 91.5 | 93.1 | 88.9 | 98.3 |
| Alabama | 7 | 90.7 | 98.3 | 76.2 | 98.9 | 92.1 | 85.4 | 97.7 |
| Michigan | 8 | 90.9 | 91.9 | 78.9 | 100.2 | 96.7 | 96.0 | 95.1 |
| Arkansas | 9 | 91.3 | 94.6 | 81.1 | 102.2 | 91.6 | 88.3 | 95.7 |
| Georgia | 10 | 91.5 | 100.2 | 77.3 | 96.5 | 96.0 | 94.3 | 96.3 |
| Missouri | 11 | 91.5 | 95.2 | 78.3 | 104.1 | 86.5 | 97.0 | 98.7 |
| Kansas | 12 | 91.9 | 92.6 | 82.1 | 97.7 | 88.6 | 96.3 | 98.9 |
| Texas | 13 | 92.4 | 90.2 | 85.8 | 93.9 | 94.6 | 96.0 | 97.3 |
| Utah | 14 | 92.5 | 95.7 | 84.5 | 89.6 | 102.0 | 89.3 | 95.8 |
| Iowa | 15 | 92.5 | 95.1 | 85.3 | 99.3 | 97.3 | 96.0 | 93.2 |
| Wyoming | 16 | 92.7 | 97.3 | 91.3 | 99.9 | 86.6 | 101.1 | 90.8 |
| Ohio | 17 | 93.0 | 99.5 | 82.3 | 100.9 | 94.8 | 96.3 | 95.8 |
| Nebraska | 18 | 93.3 | 99.5 | 85.4 | 90.6 | 98.1 | 100.8 | 95.3 |
| Louisiana | 19 | 93.8 | 96.6 | 91.2 | 87.5 | 93.8 | 95.2 | 96.6 |
| Virginia | 20 | 95.4 | 94.1 | 90.5 | 99.7 | 92.9 | 98.6 | 99.6 |
| South Carolina | 21 | 95.5 | 108.6 | 80.2 | 104.2 | 93.3 | 100.0 | 100.8 |
| North Carolina | 22 | 96.3 | 100.2 | 84.1 | 100.3 | 102.1 | 103.8 | 100.7 |
| Arizona | 23 | 96.3 | 97.5 | 92.7 | 99.0 | 98.9 | 100.3 | 96.7 |
| Illinois | 24 | 96.3 | 98.7 | 90.3 | 101.0 | 97.0 | 100.7 | 98.3 |
| Wisconsin | 25 | 97.8 | 100.4 | 89.2 | 102.5 | 99.5 | 112.0 | 100.0 |
| North Dakota | 26 | 100.1 | 105.3 | 101.3 | 90.4 | 99.6 | 109.4 | 98.7 |
| Minnesota | 27 | 100.9 | 107.2 | 96.6 | 87.3 | 98.1 | 107.8 | 106.7 |
| Florida | 28 | 101.2 | 104.9 | 98.3 | 102.5 | 105.5 | 97.3 | 100.6 |
| South Dakota | 29 | 101.3 | 105.3 | 117.9 | 87.0 | 90.6 | 93.2 | 94.8 |
| Montana | 30 | 102.1 | 101.0 | 113.1 | 85.8 | 93.5 | 105.6 | 100.9 |
| Colorado | 31 | 102.2 | 98.2 | 112.2 | 87.9 | 98.7 | 103.5 | 101.1 |
| Delaware | 32 | 103.1 | 105.0 | 94.5 | 114.2 | 98.7 | 102.2 | 107.9 |
| Washington | 33 | 104.1 | 101.7 | 109.7 | 82.9 | 107.9 | 116.2 | 103.8 |
| Pennsylvania | 34 | 104.2 | 104.9 | 99.4 | 112.1 | 112.3 | 96.7 | 103.4 |
| West Virginia | 35 | 104.8 | 94.9 | 107.0 | 93.3 | 107.1 | 95.6 | 111.4 |
| Nevada | 36 | 105.4 | 111.1 | 99.9 | 94.0 | 110.9 | 103.4 | 109.7 |
| Maine | 37 | 115.8 | 100.7 | 122.0 | 119.2 | 129.4 | 112.5 | 111.1 |
| New Hampshire | 38 | 117.4 | 102.9 | 123.1 | 136.5 | 106.3 | 116.3 | 116.9 |
| Maryland | 39 | 120.2 | 111.7 | 175.3 | 98.7 | 108.5 | 87.7 | 91.4 |
| Rhode Island | 40 | 123.3 | 111.3 | 134.7 | 126.3 | 110.5 | 116.8 | 123.3 |
| Vermont | 41 | 123.6 | 108.5 | 152.3 | 122.6 | 128.3 | 107.3 | 105.8 |
| New Jersey | 42 | 124.2 | 108.6 | 161.5 | 97.6 | 110.7 | 108.7 | 114.2 |
| Massachusetts | 43 | 126.2 | 113.5 | 156.6 | 125.8 | 117.0 | 111.4 | 110.7 |
| Oregon | 44 | 128.5 | 116.3 | 166.1 | 88.5 | 111.4 | 113.8 | 122.2 |
| Connecticut | 45 | 134.7 | 125.2 | 170.2 | 130.0 | 104.8 | 116.9 | 123.2 |
| New York | 46 | 136.1 | 107.0 | 195.6 | 108.1 | 125.6 | 105.4 | 113.9 |
| Alaska | 47 | 137.0 | 128.3 | 148.9 | 159.4 | 146.0 | 143.0 | 118.7 |
| California | 48 | 138.2 | 117.0 | 202.8 | 116.2 | 125.0 | 109.5 | 106.7 |
| District of Columbia | 49 | 143.3 | 111.8 | 244.6 | 97.6 | 121.4 | 94.3 | 97.9 |
| Hawaii | 50 | 170.8 | 155.9 | 225.3 | 227.4 | 153.1 | 111.3 | 126.2 |
| Grand Total | 100.0 | 100.0 | 100.0 | 100.0 | 100.0 | 100.0 | 100.0 | |
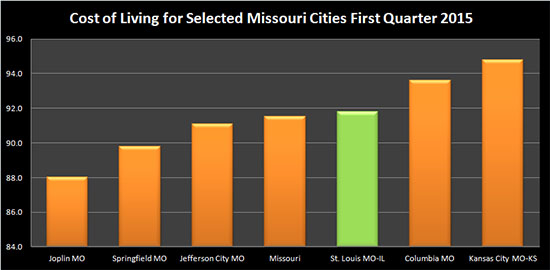
All of the participating Missouri cities had a composite index below the national average for the first quarter of 2015. The city that had the lowest index for the year was Joplin with an index of 88.0. The city with the highest index for 2015 was Kansas City with an index of 94.8.
| Cost of Living Indices for Participating Missouri Cities First Quarter 2015 | |||||||
| Metro | Index | Grocery | Housing | Utilities | Transportation | Health | Misc. |
| Joplin MO | 88.0 | 88.5 | 70.1 | 118.6 | 87.2 | 90.3 | 93.6 |
| Springfield MO | 89.8 | 100.0 | 71.7 | 103.0 | 83.0 | 94.2 | 99.0 |
| Jefferson City MO | 91.1 | 96.4 | 77.8 | 99.4 | 87.1 | 98.6 | 98.4 |
| Missouri | 91.5 | 95.2 | 78.3 | 104.1 | 86.5 | 97.0 | 98.7 |
| St. Louis MO-IL | 91.8 | 101.3 | 71.7 | 114.3 | 91.6 | 101.1 | 96.7 |
| Columbia MO | 93.6 | 96.3 | 86.6 | 96.6 | 83.0 | 98.7 | 101.0 |
| Kansas City MO-KS | 94.8 | 88.8 | 91.7 | 92.5 | 87.3 | 98.8 | 103.3 |
| US Average | 100.0 | 100.0 | 100.0 | 100.0 | 100.0 | 100.0 | 100.0 |
*ACCRA has changed its name to C2ER. See http://www.c2er.org/ for details and more data products.
