
Missouri Housing Units Rise to 2.5 Million
 There
were more than 2.5 million housing units in Missouri in 2005,
ranking the state 17th nationally. The additional 28,468 housing
units in the state accounted for an increase of 1.1 percent from
2004, according to recently released U.S. Census Bureau estimates.
Housing units in the U.S. increased by 1.5 percent over the same
period to an estimated 124.5 million. Much of the rapid housing
growth was located in the West, with Nevada (4.4 percent), Arizona
(3.5 percent), Florida (3.1 percent), Idaho (2.9 percent), and Utah
(2.9 percent) making up the top five states for growth.
A housing unit is defined as a house, apartment, group of rooms, or single room occupied or intended for occupancy as separate living quarters.
St. Louis County had the largest share of the state's housing units in 2005 with 432,486, or 16.6 percent. Jackson County (307,700 units) was second with 11.8 percent of Missouri's total.
St. Charles County had the largest numerical increase in housing units from 2004 to 2005 with 4,479, followed by Jackson (4,173), Greene (2,436), Boone (2,200) and St. Louis County (1,862).
| County | July 1, 2005 | 2004-05 Numerical Change |
2004-2005 Percentage Change |
| Missouri | 2,592,809 | 28,468 | 1.1% |
| Adair | 11,226 | 41 | 0.4% |
| Andrew | 6,935 | 10 | 0.1% |
| Atchison | 3,140 | -3 | -0.1% |
| Audrain | 11,098 | 11 | 0.1% |
| Barry | 16,790 | 41 | 0.2% |
| Barton | 5,630 | 21 | 0.4% |
| Bates | 7,537 | 61 | 0.8% |
| Benton | 13,174 | -7 | -0.1% |
| Bollinger | 5,677 | -7 | -0.1% |
| Boone | 65,283 | 2,200 | 3.5% |
| Buchanan | 37,496 | 199 | 0.5% |
| Butler | 19,274 | 15 | 0.1% |
| Caldwell | 4,659 | 52 | 1.1% |
| Callaway | 17,147 | 115 | 0.7% |
| Camden | 35,273 | 147 | 0.4% |
| Cape Girardeau | 30,872 | 182 | 0.6% |
| Carroll | 4,982 | -2 | 0.0% |
| Carter | 3,148 | -2 | -0.1% |
| Cass | 36,791 | 1,048 | 2.9% |
| Cedar | 7,057 | 13 | 0.2% |
| Chariton | 4,396 | 12 | 0.3% |
| Christian | 26,591 | 1,256 | 5.0% |
| Clark | 3,586 | 3 | 0.1% |
| Clay | 82,638 | 1,575 | 1.9% |
| Clinton | 8,698 | 149 | 1.7% |
| Cole | 31,423 | 350 | 1.1% |
| Cooper | 7,092 | 39 | 0.6% |
| Crawford | 11,313 | 13 | 0.1% |
| Dade | 3,869 | 8 | 0.2% |
| Dallas | 7,243 | 31 | 0.4% |
| Daviess | 3,979 | 9 | 0.2% |
| DeKalb | 4,079 | 35 | 0.9% |
| Dent | 7,203 | -6 | -0.1% |
| Douglas | 6,125 | -7 | -0.1% |
| Dunklin | 15,117 | 21 | 0.1% |
| Franklin | 41,583 | 735 | 1.8% |
| Gasconade | 8,090 | 4 | 0.0% |
| Gentry | 3,277 | 0 | 0.0% |
| Greene | 115,592 | 2,436 | 2.2% |
| Grundy | 5,256 | 22 | 0.4% |
| Harrison | 4,448 | 13 | 0.3% |
| Henry | 10,621 | 33 | 0.3% |
| Hickory | 6,488 | -2 | 0.0% |
| Holt | 3,009 | 0 | 0.0% |
| Howard | 4,464 | 1 | 0.0% |
| Howell | 17,116 | 89 | 0.5% |
| Iron | 5,073 | 7 | 0.1% |
| Jackson | 307,700 | 4,173 | 1.4% |
| Jasper | 48,363 | 525 | 1.1% |
| Jefferson | 83,572 | 1,635 | 2.0% |
| Johnson | 20,136 | 201 | 1.0% |
| Knox | 2,383 | 2 | 0.1% |
| Laclede | 15,275 | 119 | 0.8% |
| Lafayette | 14,319 | 148 | 1.0% |
| Lawrence | 15,454 | 110 | 0.7% |
| Lewis | 4,780 | 13 | 0.3% |
| Lincoln | 16,968 | 264 | 1.6% |
| Linn | 6,683 | 17 | 0.3% |
| Livingston | 6,682 | 20 | 0.3% |
| Macon | 7,680 | 10 | 0.1% |
| Madison | 5,882 | 24 | 0.4% |
| Maries | 4,314 | -1 | 0.0% |
| Marion | 12,727 | 46 | 0.4% |
| McDonald | 9,655 | 0 | 0.0% |
| Mercer | 2,190 | 3 | 0.1% |
| Miller | 12,008 | 78 | 0.7% |
| Mississippi | 5,944 | -5 | -0.1% |
| Moniteau | 5,945 | 9 | 0.2% |
| Monroe | 4,813 | 55 | 1.2% |
| Montgomery | 6,091 | 71 | 1.2% |
| Morgan | 14,472 | -6 | 0.0% |
| New Madrid | 8,907 | 43 | 0.5% |
| Newton | 22,953 | 80 | 0.3% |
| Nodaway | 9,422 | 61 | 0.7% |
| Oregon | 5,145 | -6 | -0.1% |
| Osage | 6,114 | 1 | 0.0% |
| Ozark | 5,331 | -1 | 0.0% |
| Pemiscot | 8,977 | 6 | 0.1% |
| Perry | 8,119 | 50 | 0.6% |
| Pettis | 17,328 | 43 | 0.2% |
| Phelps | 18,779 | 143 | 0.8% |
| Pike | 7,709 | 20 | 0.3% |
| Platte | 34,931 | 799 | 2.3% |
| Polk | 11,965 | 148 | 1.3% |
| Pulaski | 16,169 | 111 | 0.7% |
| Putnam | 3,004 | 15 | 0.5% |
| Ralls | 4,716 | -1 | 0.0% |
| Randolph | 11,064 | 68 | 0.6% |
| Ray | 9,989 | 138 | 1.4% |
| Reynolds | 3,905 | -4 | -0.1% |
| Ripley | 6,635 | -6 | -0.1% |
| Saline | 10,296 | 0 | 0.0% |
| Schuyler | 2,150 | 19 | 0.9% |
| Scotland | 2,340 | -3 | -0.1% |
| Scott | 17,557 | 55 | 0.3% |
| Shannon | 4,020 | 0 | 0.0% |
| Shelby | 3,323 | -3 | -0.1% |
| St. Charles | 127,309 | 4,479 | 3.6% |
| St. Clair | 5,423 | 11 | 0.2% |
| St. Francois | 25,833 | 284 | 1.1% |
| St. Louis city | 176,267 | -65 | 0.0% |
| St. Louis | 432,486 | 1,862 | 0.4% |
| Ste. Genevieve | 8,277 | 2 | 0.0% |
| Stoddard | 13,698 | 29 | 0.2% |
| Stone | 17,194 | 341 | 2.0% |
| Sullivan | 3,463 | 2 | 0.1% |
| Taney | 22,441 | 699 | 3.2% |
| Texas | 11,196 | 19 | 0.2% |
| Vernon | 9,123 | 15 | 0.2% |
| Warren | 13,071 | 438 | 3.5% |
| Washington | 10,312 | -7 | -0.1% |
| Wayne | 7,842 | -1 | 0.0% |
| Webster | 13,015 | 113 | 0.9% |
| Worth | 1,265 | -1 | -0.1% |
| Wright | 8,152 | 0 | 0.0% |
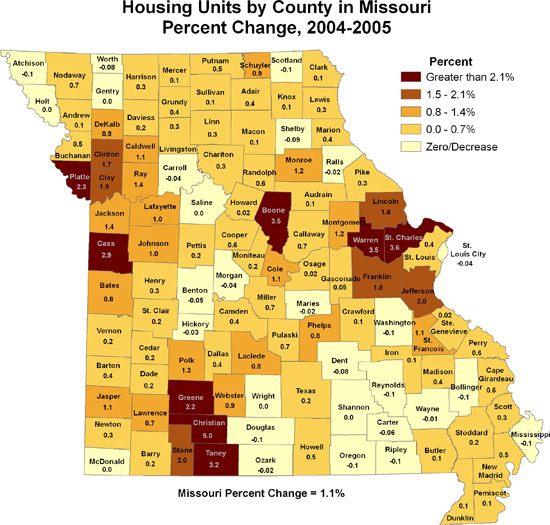
From 2004 to 2005, the most rapid rate of housing growth in Missouri was in Christian County, with an increase of 5.0 percent. Rounding out the list of fastest counties for housing growth are: St. Charles (3.6 percent), Boone (3.5 percent), Warren (3.5 percent), Taney (3.2 percent) and Cass (2.9 percent). Overall, 22 counties had housing unit increases faster than the state rate in 2005, while another 22 counties had a decrease in the number of housing units over the period.
Approximately 72.3 percent of Missourians own their home, compared to 68.9 percent nationwide.
Source: U.S. Census Bureau
