
Missouri's Hispanic Population Rises
In 2013, an estimated 219,705 Hispanics called Missouri home, an increase of over 7.7% since 2009. U.S. Census Bureau estimates for 2013 show the population of those of Hispanic origin accounted for 3.7% of Missouri’s total population.
Nationally, the population of Hispanics was estimated to be 51.8 million, or 16.6% of the nation's population, making Hispanics the largest ethnic or racial minority in the United States.
Those of Hispanic origin make up 18.4% of the population of Sullivan County in the state. McDonald County followed at 11.3%. Other top counties included Pulaski (9.5%), Saline (8.7%), Jackson (8.4%), and Barry (7.9%).
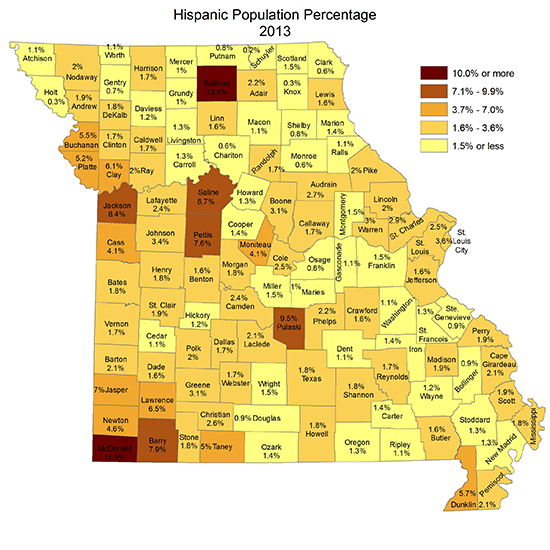
| 2013 Top Missouri Counties | |||
| by Hispanic Population Percentage | |||
| County | Total Population | Hispanic Population | Percent of Population that is Hispanic |
| Sullivan County | 6,611 | 1,215 | 18.4% |
| McDonald County | 22,892 | 2,577 | 11.3% |
| Pulaski County | 52,795 | 5,030 | 9.5% |
| Saline County | 23,324 | 2,030 | 8.7% |
| Jackson County | 675,641 | 56,797 | 8.4% |
| Barry County | 35,614 | 2,822 | 7.9% |
| Pettis County | 42,146 | 3,194 | 7.6% |
| Jasper County | 116,803 | 8,196 | 7.0% |
| Lawrence County | 38,488 | 2,511 | 6.5% |
| Clay County | 225,116 | 13,695 | 6.1% |
| Dunklin County | 31,916 | 1,829 | 5.7% |
| Buchanan County | 89,419 | 4,908 | 5.5% |
| Platte County | 90,842 | 4,755 | 5.2% |
| Taney County | 52,412 | 2,632 | 5.0% |
| Newton County | 58,552 | 2,688 | 4.6% |
Jackson County
had the largest total Hispanic population in the state with an estimated total of 56,797. St. Louis County's Hispanic population was the second largest, estimated at 25,478. Other top counties included Clay (13,695), St. Louis City (11,390), and St. Charles (10,518).
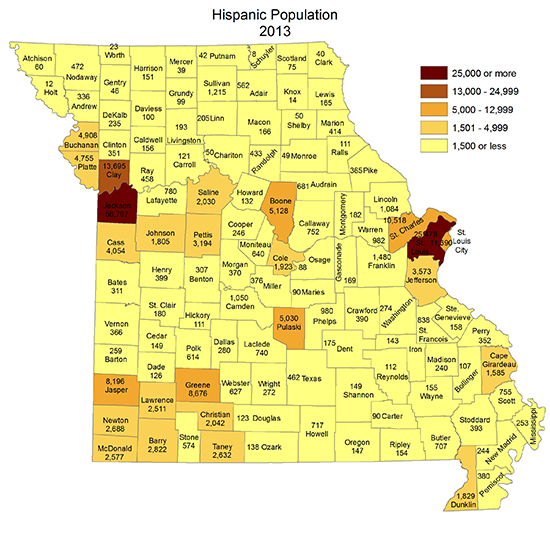
| 2013 Top Missouri Counties | |||
| by Hispanic Population | |||
| County | Total Population | Hispanic Population | Percentage of County Population that is Hispanic |
| Jackson County | 675,641 | 56,797 | 8.4% |
| St. Louis County | 999,725 | 25,478 | 2.5% |
| Clay County | 225,116 | 13,695 | 6.1% |
| St. Louis city | 318,955 | 11,390 | 3.6% |
| St. Charles County | 365,101 | 10,518 | 2.9% |
| Greene County | 278,231 | 8,676 | 3.1% |
| Jasper County | 116,803 | 8,196 | 7.0% |
| Boone County | 165,776 | 5,128 | 3.1% |
| Pulaski County | 52,795 | 5,030 | 9.5% |
| Buchanan County | 89,419 | 4,908 | 5.5% |
| Platte County | 90,842 | 4,755 | 5.2% |
| Cass County | 99,875 | 4,054 | 4.1% |
| Jefferson County | 219,636 | 3,573 | 1.6% |
| Pettis County | 42,146 | 3,194 | 7.6% |
| Barry County | 35,614 | 2,822 | 7.9% |
Source: American Community Survey 5 year estimates, US Census Bureau

MERIC Home